I’m using your Insights functions “Rolling Aggregation by Duration” and “Rolling Aggregation by Count”.
Murano Business ID: gcnl3llwrm; ExoSense App ID: s4q3o8h6oshw00000
I have four problems:
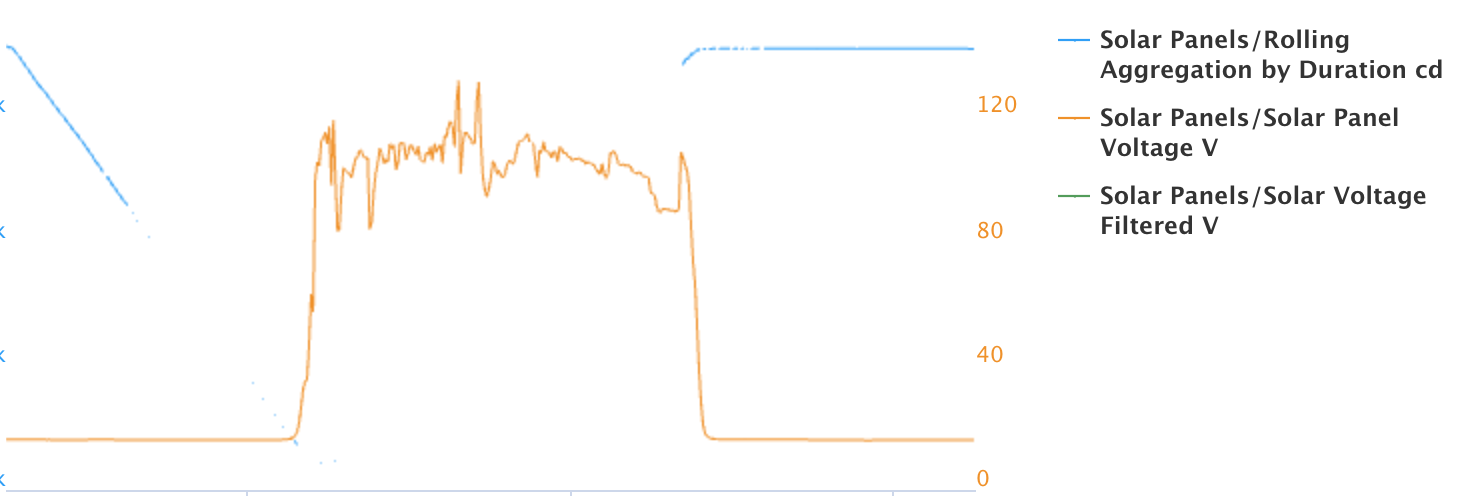
The “Rolling Aggregation by Duration” kind of works. I have it set to SUM over 86,400 seconds on my Solar voltage. It seems to sum up the data over time, but very often, the output signal is blank even when there are valid inputs (every minute) over the past 24 hours:
Can someone tell me why the output signal is often blank?
The data from the “Rolling Aggregation by Duration” does not create a valid output signal - I expect it to sum up each point over a rolling 86,400 second window and generate a rolling output signal. The “right” output signal profile looks something like the following, but the output signal profile I get is the screen shot above in #1.
[Sorry a New User can only input one image per post]
Am I hitting some sort of processing maximum that is limiting the insight summation?
The “Rolling Aggregation by Count” never works. I have it set to MAX over 2 data points (every once in a while, my data feed will include a bogus zero value - the MAX by 2 should remove all of those). The output signal on that is never created although the input data is coming in once a minute.
Why can I only post one image per post in this forum?
@ampscale - What is your report rate for your solar panel voltage? Curious how many data points would be processed when trying to sum over 1 day period.
@ampscale
In regards to #3, I have a couple of questions for you…
To clarify, You mentioned that The output signal is never created. Do you mean that the signal value is never updating, or that there is literally no new output signal coming from the Transform? For example, in the Modify Asset page, do you see:
  A. Input Signal >>>> Transform >>>>> Output Signal with no value
      -- or --
  B. Input Signal >>>> Transform
What is the type/unit of the data being reported for the signal?
In the Transform Edit screen, what is the output signals type/unit set to?
3.2 -> the type of raw data being reported is V. That gets converted to a new V unit that is actually the right scale (Battery Volts). That is then used in the “Rolling Aggregation by Count” Insight to create an output value that has been set to a unit of “S” (due to inability to set different axis in graphs unless units are different).
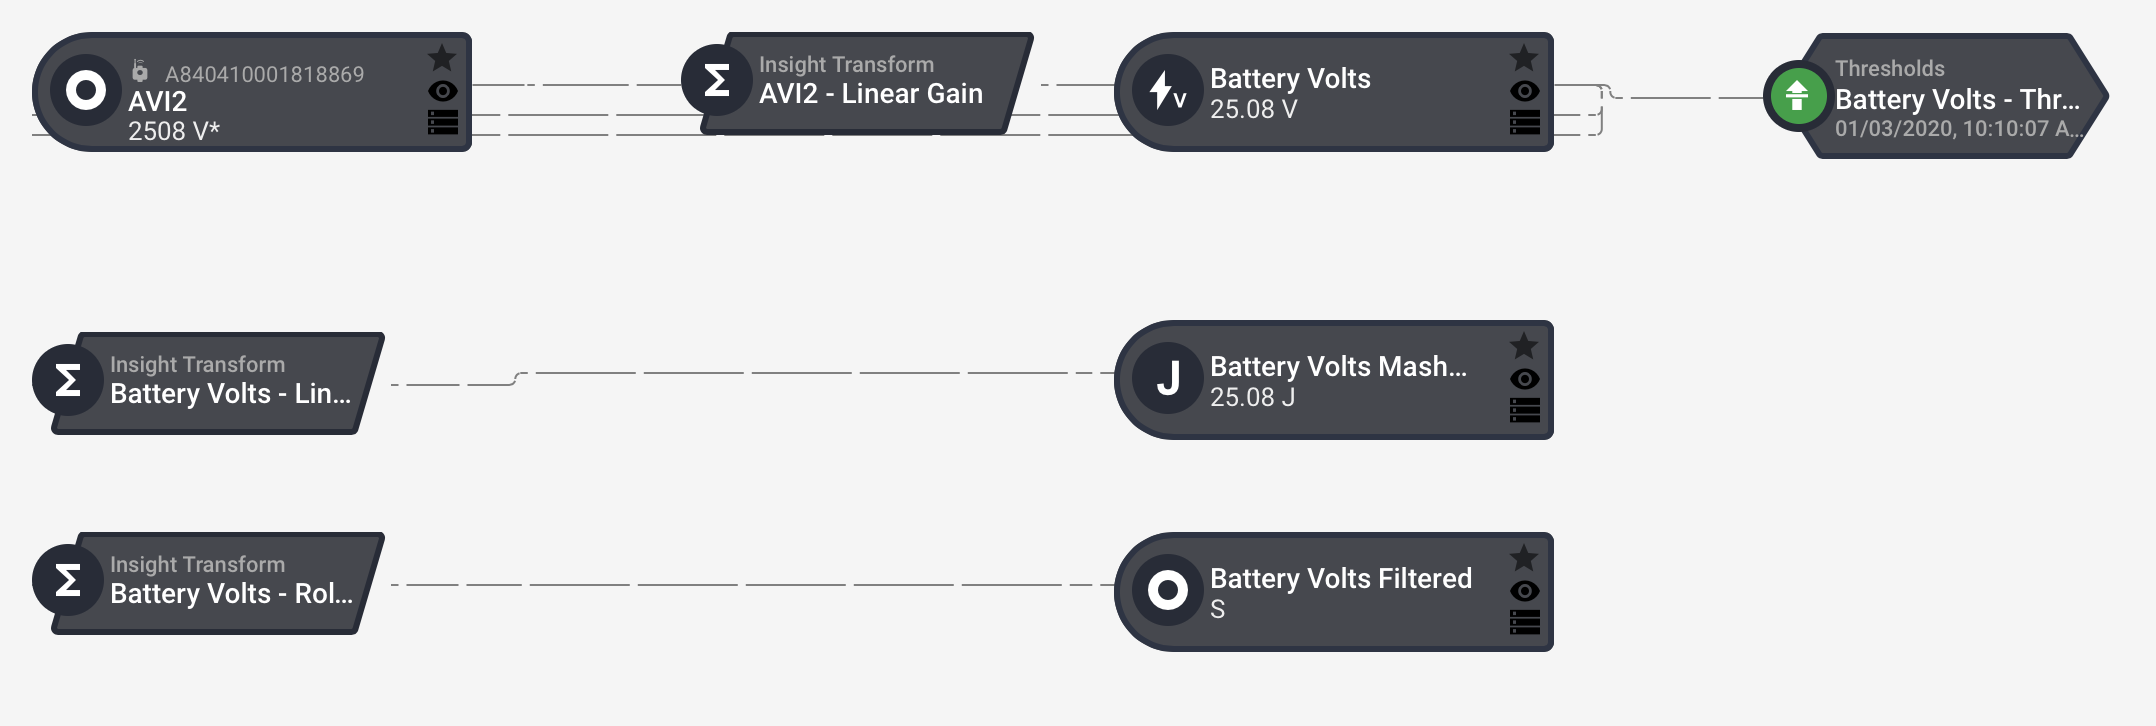
It looks like the two transforms (“Battery Volts - Lin…” and “Battery Volts - Rol…”) do not have an input, but maybe this is just because of the screen shot. If this is true though, than that is why they are not getting updated.
Is there any chance these Transforms were created with an input signal that was deleted. I.e. was ‘Battery Volts’ once deleted and readded?
What’s the use case for two signals that are of the same unit but having different axis (and therefore scale different I assume)? A follow up question. Is there a specific reason these are needed on the same graph?
The use case for two signals with same unit and different axis in this case is a solar power system.
There are a variety of voltages running through the system, all pertinent to system performance. For example, Solar Panel Volts is in a range from 0 to 150v (in this case, higher ranges in many other cases), while Battery Volts is in a range from 23 to 30v (other small gauge ranges apply at different scales). Solar panels are charging the battery, so it is informative to show the voltages on the same graph (when solar voltage hits a certain minimum, batteries will start to charge, and then there are interesting interactions thereafter depending on solar max power point etc…). Also, cumulative voltage - which I’m trying to create with the Insight I mentioned in #2 - is an interesting number, with a unit of Vh (or just V), that I have on the same graph. The accumulated Vh is related to the overall battery state of charge at a given point in time of the use cycle, which can be estimated from the battery voltage on successive days at the same time.
There are also many use cases for Amps that would be informative on the same graph (battery Amps vs. load Amps vs. input Amps) but that will all have different scales.
The raw unit items are all used/graphed just to inform the user on how to assemble an Insight that actually tells me when things are healthy or not. After creating the Insights, assuming they are stable/trustworthy, the raw unit items will just be used for reference upon anomaly.
It is interesting, some of the signals show little lines, and some do not. The fact of if they show an input line or not does not seem to correlate to their ability to create an output. As you can see in the image under 3.1 above, the “Battery Volts Mashup” has an output value, while the “Battery Volts Filtered” does not - however, both are not showing an input line. None of the signals in question were created from an input signal that was subsequently deleted - all are as they were when created.
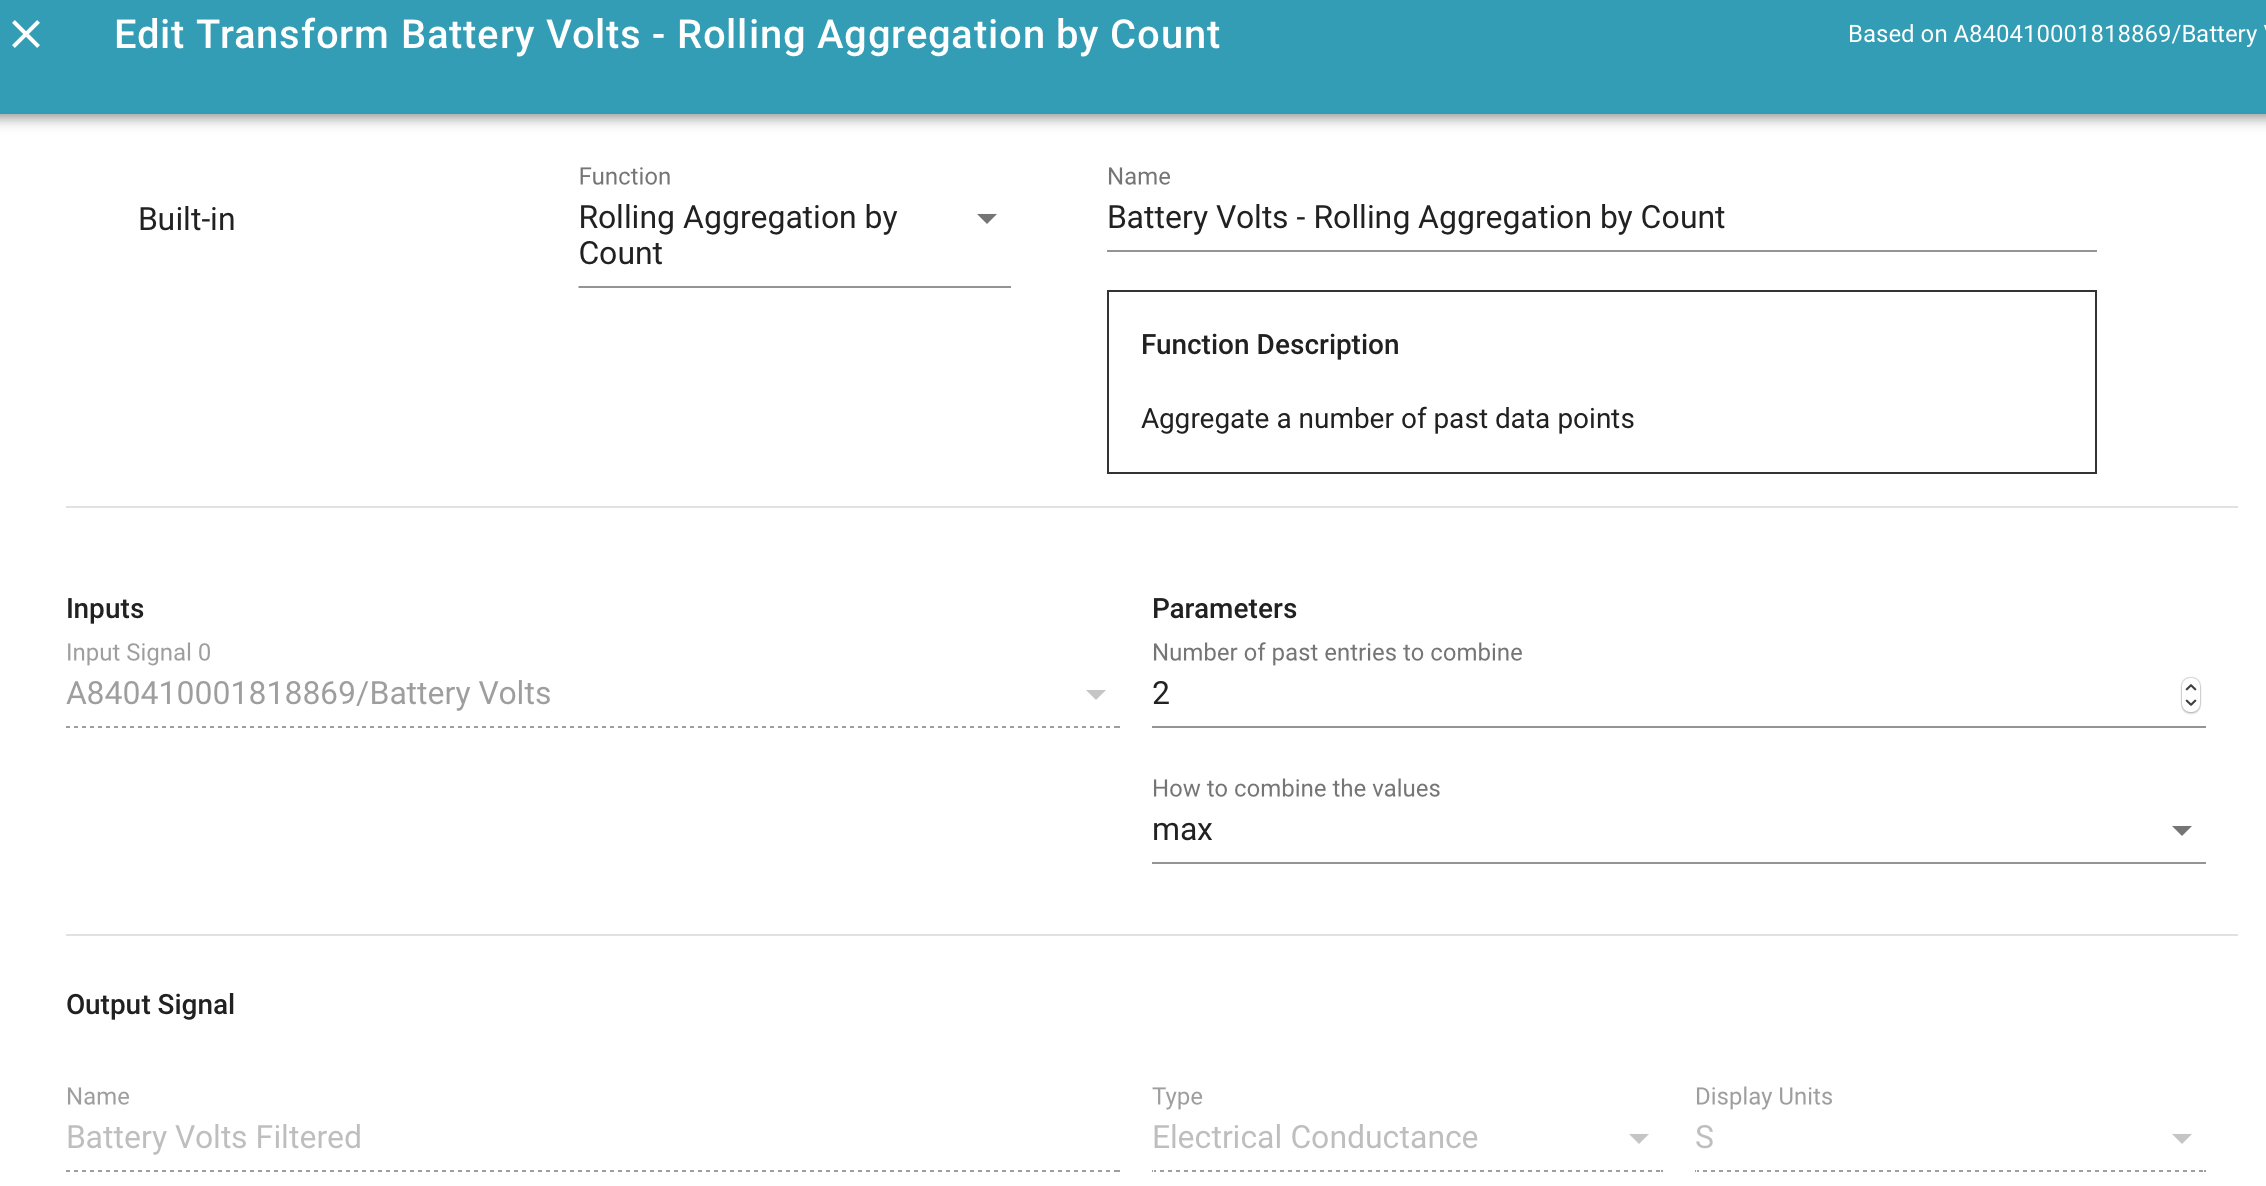
Here is the signal setup for “Battery Volts - Rolling Aggregation by Count” showing the input signal of “A4…/Battery Volts” (Note that the “Battery Volts - Linear Transform”, which does work, has the exact same Input Signal listed)
OK, posting an update here - everything is now working!
The root causes of all three issues were 2:
The way that the TheThingsNetwork C2C connector was reporting data used an incorrect timestamp. As a result, the ExoSense UIs would show the data (because it uses web sockets and shows real time information) but the Insights would not calculate correctly, or at all, because they require a valid timestamp. We corrected the reported timestamp and immediately the data started being calculated correctly.
The number of points being processed was too high. However, an ExoSense change was already in the works to allow a higher number of processing points, and my use case happened to be within the allocated number.
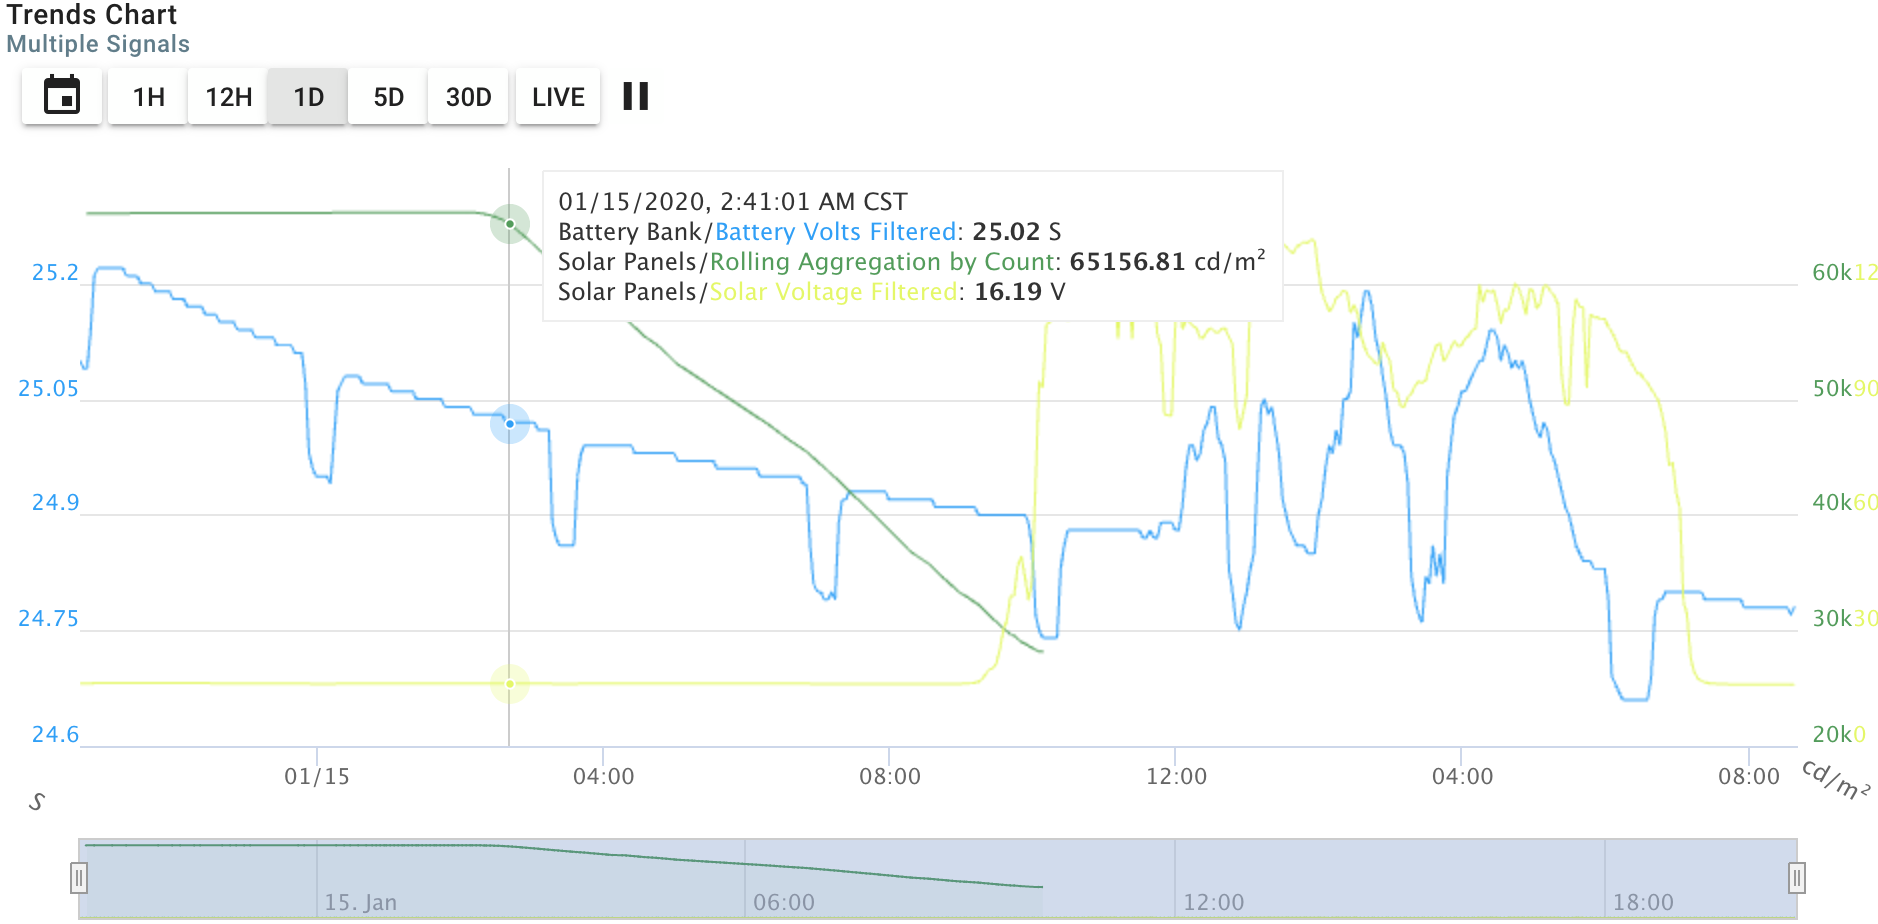
Also, I thought I’d share a graph of the filtered data enabled by the Insight (the blue is the raw data with glitches due to sensor/wireless drop-outs and the orange is the auto-corrected data with the Insight!):
Actually, it looks like for #1, the release of ExoSense that will allow the higher number of points is probably still not released, so the graph still has many gaps (green line below):